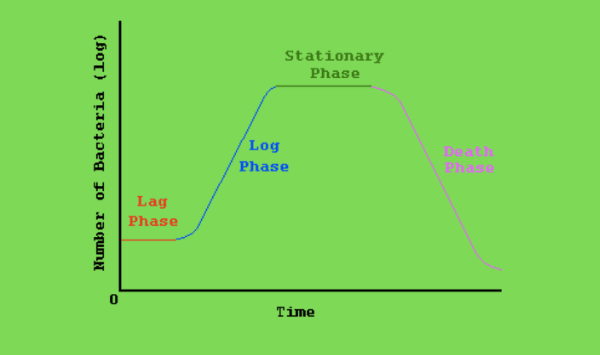
In microbiology, the bacterial growth curve describes the size or population of live cells or bacteria in a culture over time, which can be best described by the 4 phases: the lag phase, the log phase, the stationary phase, and the death phase.
Once the microorganisms have settled on the host or new environment, their population initially grows slowly. Commonly, bacteria reproduce by binary fission. This way, a single cell splits into two equal-sized cells. And then 4 cells, then 8 cells, then 16 cells, then 32 cells, so on and so forth (exponential growth). Fission, spore production, and budding are less common forms of asexual reproduction.
Once they have settled, Their rate of reproduction gradually enters an acceleration phase. At this point, rapid multiplication and then the equilibrium of population occur. This is especially true when food and other requirements that favor their growth are met satisfactorily. This behavior follows an S-shaped growth curve or sigmoid curve.
Let’s further discuss all of the 4 phases of growth of bacteria.

Lag phase
The lag phase is where it all starts. While in the lag phase, the cells adjust to their environment. Do the conditions in the environment favor them to grow? Is there sufficient food (medium), water, etc.? The population size also remains constant, and the cells only grow in size.
Although the lag phase mainly involves adapting to the growth conditions, some processes are already occurring. These include the synthesizing of RNA to produce proteins necessary for exponential growth; and enzymes required for cell division. The lag phase can last from an hour up to a few days. Although the exact length varies depending on certain factors such as the growth medium, physiological history of the cells and the precise physiochemical environment of both the original and the new growth medium.
If the cells had been placed in a nutrient-rich medium, and then transferred to a poorer medium, the cell will need to produce enzymes first, hence the lag phase will be longer.
Injured cells will require more time to repair themselves before they proceed to reproduction.
If the new environment is kind of similar to the previous environment they were transferred from, the lag phase will take a shorter time. Otherwise, the adjustment time will take longer.
Log phase
Once the population enters the log phase, the growth continues, but at a faster rate. This eventually leads to an exponential or logarithmic growth phase wherein the cells reach the highest rate of reproduction. The population increases directly with time. If not limited, the growth of the bacterial population keeps on at a constant rate. The population increases directly with time. Plotting the movement will result in a straight line on a logarithmic graph.
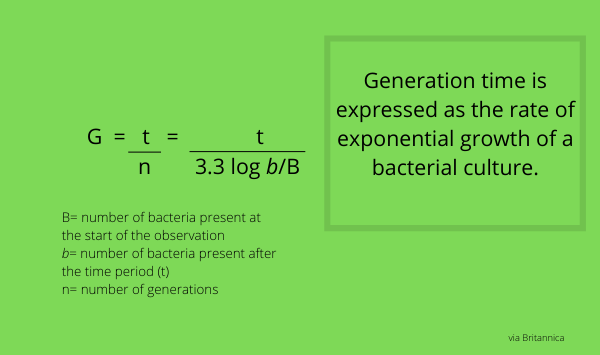
The generation time will largely vary on the type of bacteria. However, when optimum conditions are met, the generation time for most common bacteria is around 20 to 60 minutes. Escherichia coli can double the number in 20 minutes in a nutrient-rich environment. However, some bacteria can generate much quicker. For example, the spore-forming Clostridium perfringens has a generation time of just 10 minutes.
The behavior of growth of bacteria is predictable in the log phase, especially in a controlled environment like a growth medium. The generation time can be calculated by the below formula.

It is true that the log phase, among all the phases, is when the rate of the growth of bacteria is at the quickest. However, the rate of metabolic activity is also the reason why cells at this stage are highly susceptible to the action of antimicrobial agents such disinfectants.
Stationary phase
Once the environment is becoming worse, the growth transitions from log phase to the stationary phase. At this phase, the nutrients are starting to deplete rapidly, and the toxins or waste products are starting to accumulate. Physical and chemical stresses such as change in temperature and pH (acidity) also push the cells to enter this phase.
The cells still divide. However, other cells also start to die resulting in an equilibrium. The stationary phase results in a horizontal straight line when plotted on a logarithmic graph.
At this point, cells are no longer growing in number. However, they are still active metabolically as physiological, morphological, and gene changes take place to adapt to the worsening scenario. The cells change shape; they become spherical and shrink in size. They also activate a mechanism that reprograms the gene to adapt to the stress. In doing so, instead of consuming nutrients as they normally would in log phase, they synthesize amino acids to survive until the conditions of the environment improve.
During prolonged stationary phase, some bacteria enter Growth Advantage in Stationary Phase (GASP) phenotype. In this state, cells continue to grow even in a nutrient-deprived environment. This mutation allows living cells to scavenge nutrients from dead cells. Some bacteria including E. coli, Campylobacter, Pseudomonas are capable of entering this state.
Bacteria from the genera Bacillus and Clostridium, release spore especially during the stationary phase to help them combat the severing environment.
Death phase
The death phase is the last of all the phases of growth of bacteria. At this stage, the number of living cells decreases at an exponential rate.
This phase proceeds when the nutrients available have significantly depleted, the waste product accumulation has proceeded to a point of overcrowding, and the environment is no longer favorable to support the growth of cells. As a result, death rate is faster than cell regeneration. Plotting the movement of the death phase will result in a downward steep line on a logarithmic graph.
Although so-called death phase, it is worth noting that not all cells die at this stage. This is more likely because of their ability to mutate, which they usually start exhibiting in the stationary phase.
Another way they do to survive is by consuming nutrients from dead cells. Once the cells die, they are no longer able to reproduce. The cell membrane no longer works, and the lysate, the nutrients it holds, becomes available to the surviving cells.
Other references:
G. J. Tortora, B. R. Funke, C. L. Case, Microbiology: An Introduction. Benjamin-Cummings Publishing Co (10th edition), 2010
H. Ramaswamy, Post-harvest Technologies of Fruits & Vegetables. DEStech Publications, Inc, 2015


